
2.2.4 Creating dot plots
In this course we will write functions to create dot plots for two viruses. You can download the sequences by clicking the following links: dengue and zika. Right click it, and choose “Save as…” and choose the Bioinformatics/workspace folder that is in the desktop, as always.
When the data is ready, load it in R:
> library(seqinr)
> dengue <- read.fasta("dengue.fasta")[[1]]
> zika <- read.fasta("zika.fasta")[[1]]
1 Dot plots
A dot plot is a graphical method for comparing two biological sequences and identifying regions of close similarity after sequence alignment. It is one of the oldest techniquest for comparing base sequences.
The technique is the following. Build a graph with two axis, with one gene sequence in each axis. In the position (i,j) put a black dot if the base in the position i of the first sequence is the same as the base in the position j in the second sequence. Othewise, put a white dot.
2 How to make a dot plot
In R, is is possible to make a dot plot using the seqinr library. To do a dot plot for a small part of the dengue gene:
> dengue100 <- dengue[1:100]
> dotPlot(dengue100,dengue100)
Why a small section? Dot plots are expensive to calculate. For 100 bases, one needs 10,000 operations. For 10,000 bases, one needs 100,000,000 operations. It grows very fast, so it can take a long time to calculate.

3 Comparing two sequences
Besides comparing a sequence with itself, we can compare two different sequences:
> zika100 <- zika[1:100]
> dotPlot(dengue100,zika100)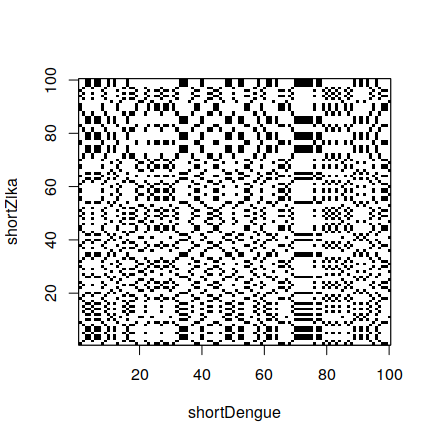 # Reducing the amount of points
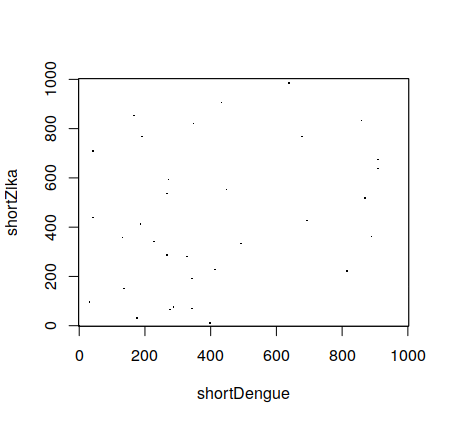
Large dot plots can be difficult to interpret, because of the large amount of dots. In order to reduce the amount of dots, we can only draw them not at every point where there is a base match, but every time we meet a sequence with a given size. For example, we add a dot when we see ATG in both genes.
Therefore, instead of doing dotPlot(dengue1000,zika1000) getting:

We can do instead:
dotPlot(shortDengue, shortZika, wsize = 5, wstep=5, nmatch = 5)and get:
which has less points. You can test with different parameters to see the results.
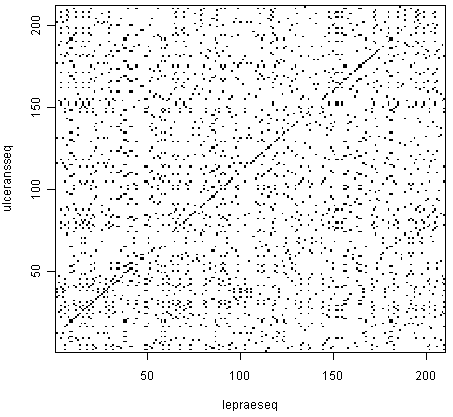
By choosing larger window sizes, we can do larger dot plots. For example:
dotPlot(dengue, dengue, wsize = 50, nmatch = 50, wstep = 50)is possible, while using 1 instead of 50 is not. You can try with values as low as 10.
Try doing the full dot plot for dengue and zika. There is a dot at the upper right part of it. If we focus on it:
dotPlot(dengue[9000:10000], zika[9000:10000], wsize = 5, nmatch = 5, wstep = 5)we get:
